
While we hear about multinational conglomerates in the news almost daily, we seldom hear about the small businesses that play a critical role in global economies.
Small businesses not only make up the vast majority of all businesses, but they are also essential to driving local commerce, trade, and labor markets. That’s why their aggregate revenue practically runs both state and national economies.
On top of that, small businesses tend to be better competition creators due to lower barriers to entry. That often leads to more innovation, fairer prices, and better labor practices, among other positives.
We compiled 14 amazing small business revenue statistics to paint a more complete picture of their individual and collective impact — and reveal trends that may show how small businesses will affect our future.
Let’s dive right in.
1. In the US, 99.9% of all companies are small businesses, totaling nearly 33.2 million (Source)
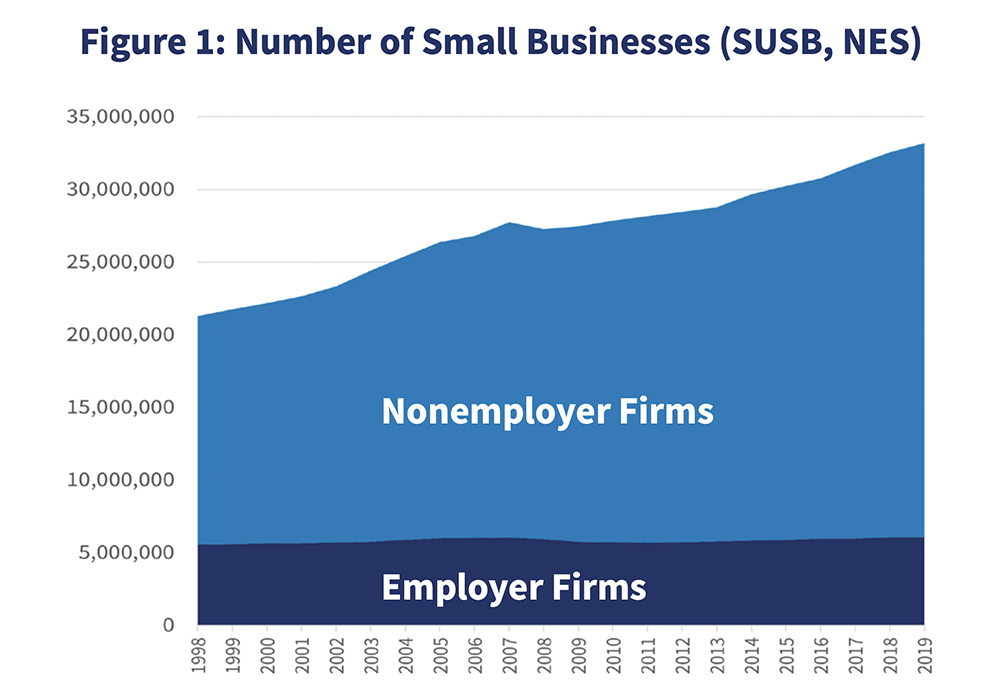
The Office of Advocacy defines a small business as an independent enterprise with fewer than 500 employees. According to the most recent data from the US Census Bureau, nearly all companies in the United States are classified as small businesses. Only 20,868 companies are classified as large businesses, comprising .01% of total businesses.
Of small businesses, 81.7% are nonemployer firms, meaning they have no employees. Meanwhile, the other 18.3% are employer firms and have paid employees working full-time, part-time, or contractually.
According to a US Small Business Administration (SBA) report released in 2023 that cited data from 2019, the number of nonemployer firms gradually increased from 15.4 million in 1997 to 27.1 million that year, with the exception of a decline during the Great Recession.
This trend is not limited to the US. In fact, according to WorldBank, 90% of all businesses in the world are small and medium enterprises (SMEs). They represent 50% of employment globally and up to 40% of gross domestic product (GDP) in emerging economies. Additionally, SMEs create roughly 70% of jobs in most developing countries.
2. Revenue from small businesses accounts for 43.5% of America’s gross domestic product
(Source)
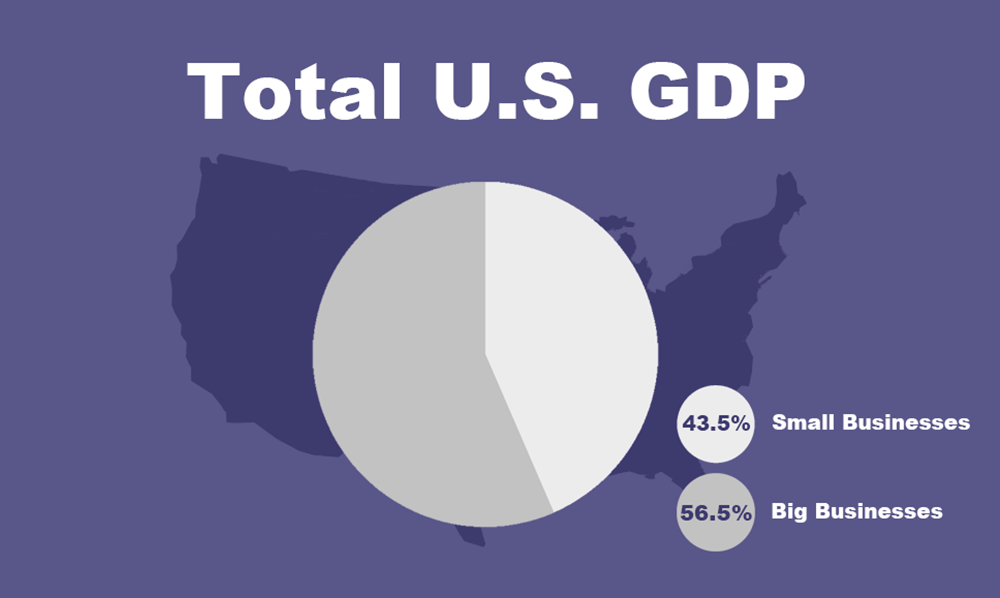
Multibillion-dollar corporations may dominate the headlines, but annual revenue from small businesses approaches half of the total American GDP. However, data shows the percentage of the national GDP represented by small businesses has been shrinking since the 1990s.
Despite that, frequently cited data from the US Small Business Administration indicates small businesses create roughly two-thirds of all net new jobs in the nation. Small businesses also contribute 44% of economic activity in the nation, but this share has gradually declined over the years.
3. SMEs have helped create about 73% of new private sector jobs since 2010 (Source)
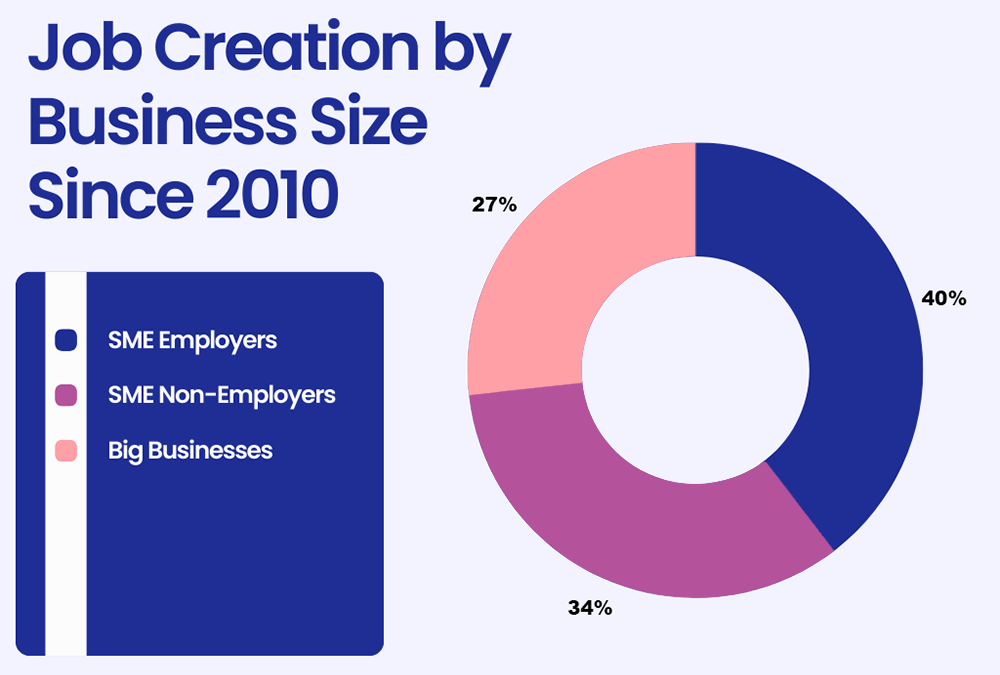
Despite the fact that SMEs account for only 60% of overall private-sector employment, they’re the leading job creators. This expansive hiring points to increasing SME revenue.
Research by Nesta shows that in the UK, based on 2.8 million new jobs created, about 40% came from SME employers. Meanwhile, about 34% of jobs originated from SME non-employers, and big businesses were responsible for only about 27% of job creation.
4. Roughly half of small businesses generate less than $500,000 each year, at 53% (Source)
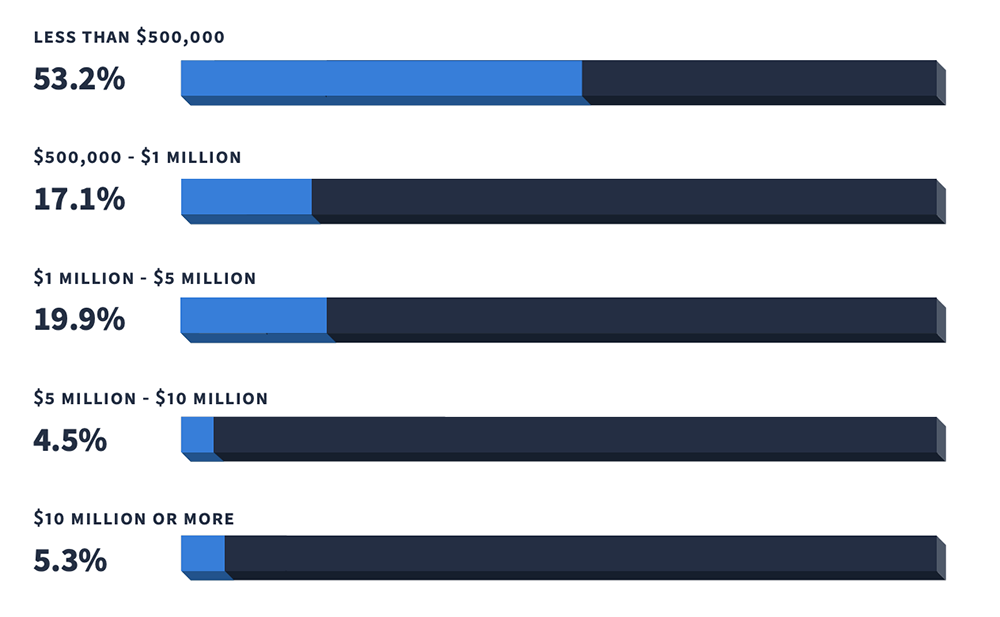
According to Veem’s most recent State of Small Business report, only 17.1% of small businesses generate between $500,000 and $1 million annually. Meanwhile, 19.9% of small businesses generated $1 million to $5 million, 4.5% created $5 million to $10 million in revenue, and 5.3% of small businesses generated more than $10 million.
The report also found that nearly one in six small business owners (14.7%) operate a business in the retail industry, the largest percentage of any industry. Meanwhile, 10.7% are in the financial services industry, 3.9% are in transportation, 3.6% are in hospitality (for example, hotels and restaurants), and 3.4% own a business in the entertainment industry.
At 63.7%, the vast majority of entrepreneurs who responded to the survey reported their industry as “other.”
While revenue can affect the number of employees a business hires, it does not correlate directly, as there are other factors involved in that decision. For example, a new business may be slow to expand its staff although revenues are high, and not all small businesses need to hire employees.
Of small business owners surveyed for the report, 69.4% had 10 or fewer employees, 14.3% had between 10-20, 3% had 20-30 employees, 2.14% had 30-40, and 11.1% had 40 or more employees.
5. 76.9% of small business owners are either ‘very’ or ‘somewhat concerned’ about rising interest rates, but 20.6% aren’t concerned (Source)
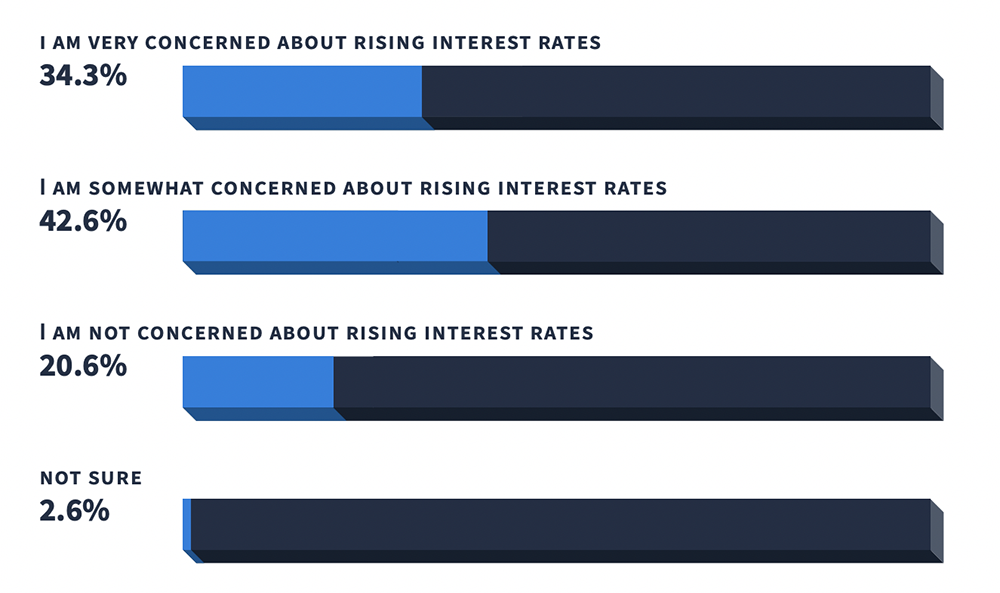
Interest rates have a direct impact on borrowing costs, changes in consumer spending habits, and credit card costs — all of which impact the revenues of small businesses.
Of the 468 small business owners in the US and Canada interviewed in the Veem survey, 34.3% were very concerned about rising interest rates while 42.6% were somewhat concerned. Roughly one in five, at 20.6%, were not concerned about rising interest rates and 2.6% said they were not sure.
Higher interest rates make it difficult for small businesses to obtain private small business loans while also making outstanding loans more expensive, especially if existing loans have variable interest rates.
A lack of access to loans can mean less or no funding. Many small businesses rely on microloans to ensure positive cash flow, complete credit LCs, and more.
So it’s reasonable that more than three-fourths of small business owners are at least somewhat concerned about rising interest rates.
6. About 63% of small business owners are worried or somewhat worried about financial health due to rising interest rates and inflation (Source)
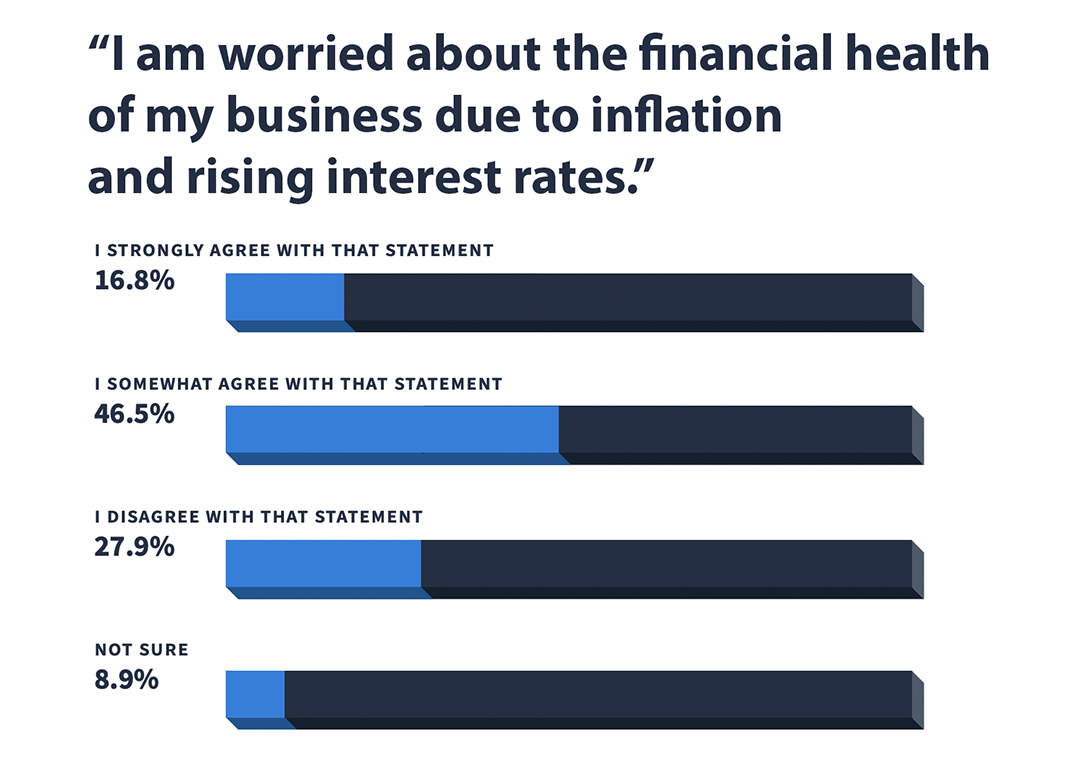
Of respondents to the Veem survey, 16.8% strongly agreed with the statement that they feared inflation and rising interest rates would damage the financial health of their small businesses. An additional 46.5% somewhat agreed with the statement.
Meanwhile, 27.9% of respondents said they weren’t worried and 8.9% were unsure of the impact of inflation and rising interest rates.
Inflation and rising interest rates can have a strong effect on the financial health of small businesses. Things like liquidity, solvency, operating efficiency, and profitability are crucial to the success of small businesses.
7. Out of revenues earned, the average small business owner pays themselves $68,853 per year
(Source)
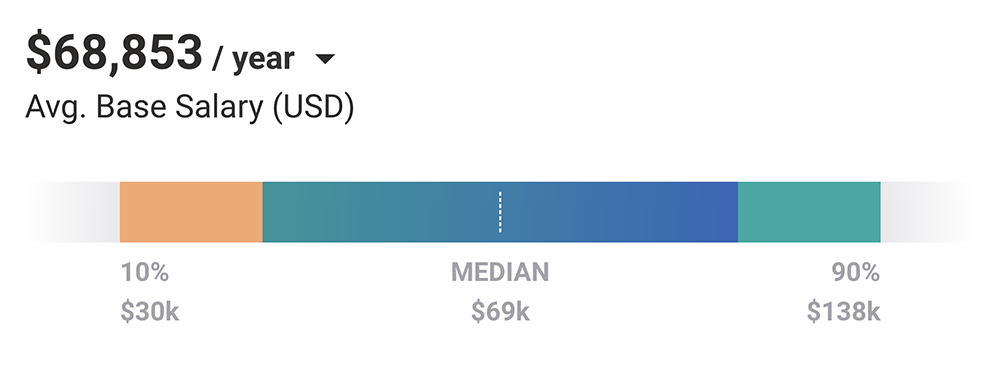
The median annual base pay for small business owners is $69,000. Meanwhile, based on 426 salary profiles the Payscale report found that small business owners in the 10th percentile earn a yearly base salary of $30,000 and those in the 90th percentile earn $138,000.
For comparison, according to the Bureau of Labor Statistics the average salary of a full-time worker in the US was roughly $57,200 in the second quarter of 2023, not seasonally adjusted. Therefore, the average small business owner earns more than the average full-time US worker.
8. At small businesses, the average base pay for employees is $30,000 to $138,000 per year
(Source)
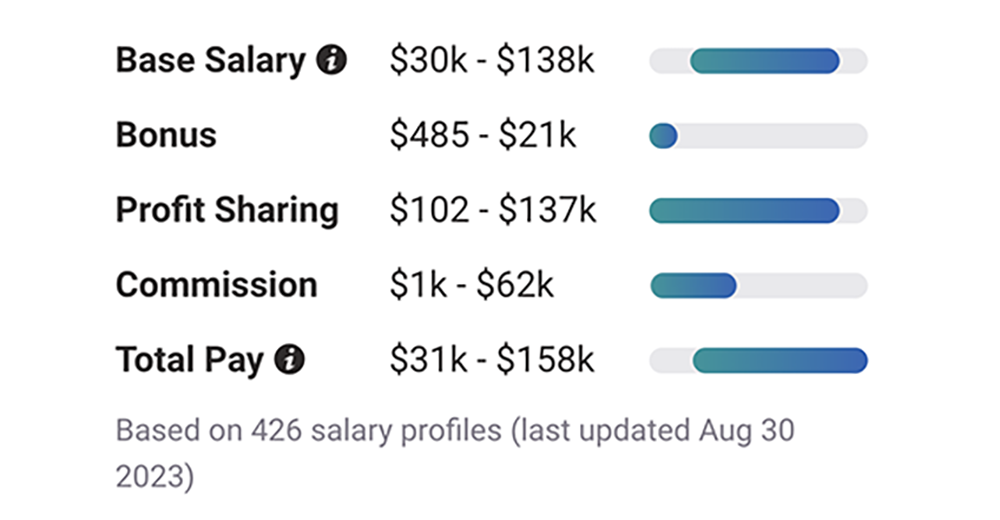
Base salary does not include taxes and deductions, nor does it include bonuses, profit sharing, or commission.
Most small businesses owners are not able to offer high salaries — for themselves or their employees. This is particularly true for SMBs with an annual revenue of less than $500,000. Since 53.2% of small companies are in that category, more than half of SMB owners may search for other incentives to compensate themselves and their employees.
The Payscale study found that annual bonuses for small business owners range between $485 and $21,000, profit sharing spans from $102,000 to $137,000, and commission ranges from $1,000 to $62,000.
All of this adds up to a total pay range of $31,000 to $158,000 annually for small business owners.
Typically, commission is a key part of salary for roles that involve direct sales. A good majority of small business owners prefer to pay themselves a salary to better adjust finances, especially nonemployer firms. Meanwhile, they use profits to expand their business, pay off loans, and manage overhead.
9. On average, 41% of small businesses plan to put more revenue back into investments (Source)
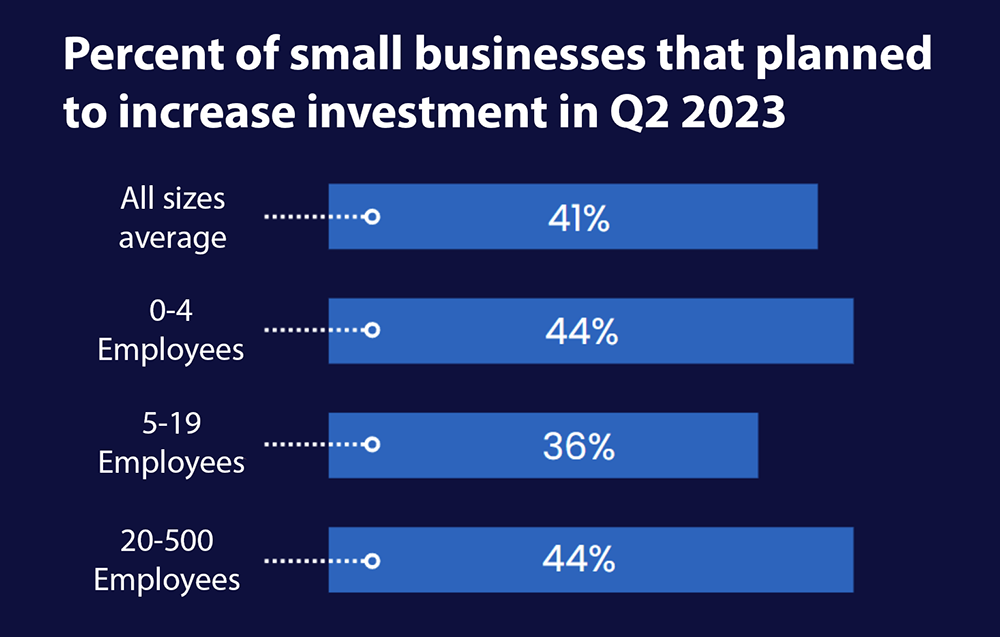
Q2 2023 showed optimism among small businesses with zero to four employees, as 44% of them plan to increase future investments this quarter. This percentage is identical for small businesses with a higher range of 20-500 employees. Meanwhile, 36% of small businesses with 5-19 employees intend to increase investment.
The US Chamber of Commerce study also found that 47% of small businesses anticipate increasing staff in the upcoming year. For comparison, in the previous quarter only 37% of small businesses had similar plans.
For small businesses, the use of revenue, investments, and staffing changes significantly based on the industry. For example, 11% of small business owners in the retail industry expected revenue to decrease over the next year. Meanwhile, only 4% of small business owners in the professional service industry had the same expectations.
Furthermore, 15% of SMBs in the retail industry said they intended to reduce investment over the following year, compared to 8% of owners in the services industry and 5% of small business owners in the professional service industry.
10. As of Q2 2023, the US Chamber of Commerce and MetLife Small Business Index score is lower (63.1) than at the same time the previous year (66.8) (Source)
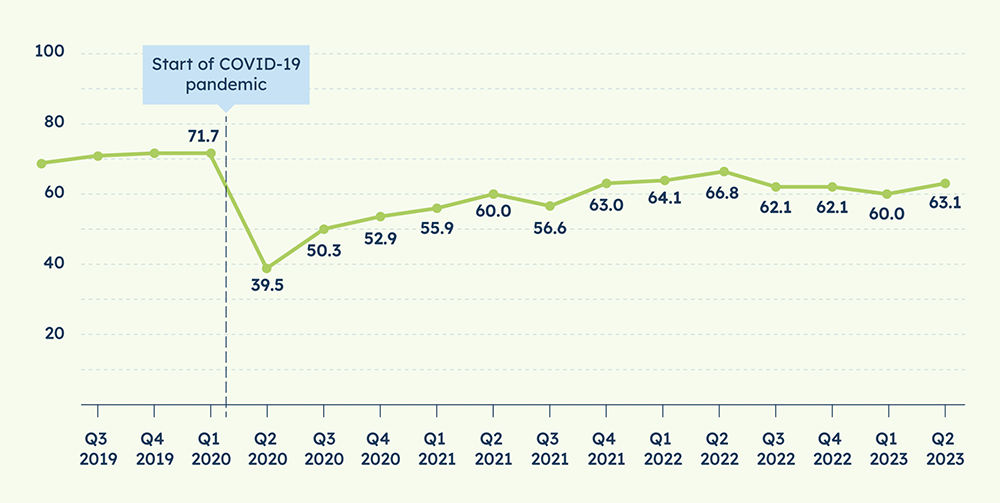
The index was at its highest in Q1 2020 at 71.7 but suffered a dramatic drop to 39.5 in Q2 2020 during the peak of the COVID-19 pandemic.
According to the US Chamber of Commerce Small Business Index, 54% of SMB owners believe inflation is their top challenge. Furthermore, small business owners say inflation and rising interest rates are the reason for changing behavior regarding business practices.
In fact, 76% of small business owners reported that rising interest rates limit opportunities to raise capital to finance their business. This is a 10% increase from the previous quarter and a 16% increase from the previous year.
Additionally, 50% of SMB owners say interest rates have put plans to grow their business on hold, and 74% fear interest rates will make it more difficult to pay back loans. More than one-third (36%) are strongly concerned. Meanwhile, 73% of small business owners report that it’s more difficult to borrow from lenders due to banks tightening lines of credit.
As a result, 71% of SMB owners are turning to personal savings, 67% are relying on credit cards, and 59% have sought assistance from local banks or credit unions. Furthermore, 41% of small business owners surveyed are now on fixed rate loans and 26% have turned to variable rate bank loans.
Despite this, revenue expectations and hiring plans are at record highs since the chamber began gathering that data in 2017. An encouraging 17% of small business owners surveyed expect revenue to increase in 2024. This is an increase of 7% over the previous quarter. And 47% of SMB owners expect to increase staff over the next year, an increase of 10% over the previous quarter.
11. Marketing budgets account for a total of 14.5% of small business revenue, compared to 14.8% of overall budgets (Source)
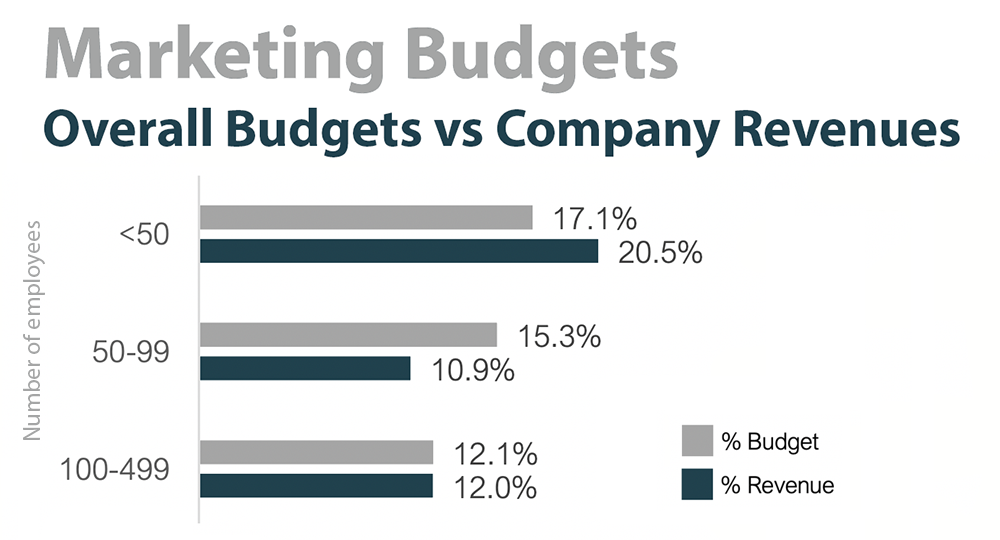
For small businesses with fewer than 50 employees, marketing budgets account for 20.5% of company revenues and 17.1% of total budget. Meanwhile, for small businesses with between 50 and 99 employees, the marketing budget accounts for 10.9% of the revenue and 15.3% of the total budget.
For SMBs with 100-499 employees, the marketing budget accounts for 12% of the revenue and 12.1% of the total budget.
This includes digital marketing, social media marketing, influencer marketing, and traditional channels for e-commerce as well as brick-and-mortar businesses.
Therefore, as small businesses increase staff, the overall marketing budget tends to decrease regardless of revenue changes.
12. Only 66% of small business owners reported profitability in the last year, but 76% believe they can survive today’s economy (Source)
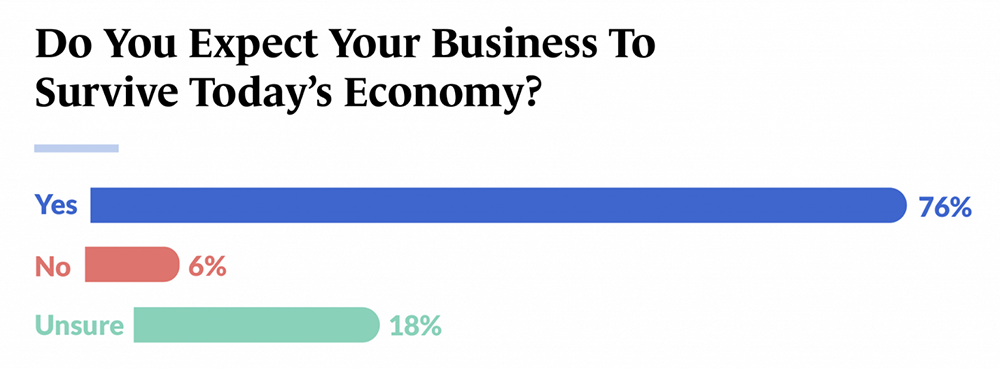
Meanwhile, 34% of SMB owners surveyed by Guidant Financial claimed their business was currently unprofitable, which can be attributed to inflationary trends. Despite that, only 6% of owners said they did not expect their business to survive today’s economy, and 18% said they were unsure.
Regardless of profitability, a strong majority of small business owners believe they will survive the pitfalls that cause high small business failure rates and successfully navigate current inflation and rising interest rates. This is across all demographics, including women-owned businesses.
For context, in a stable economy 20% of small businesses fail in the first year, according to Fundera, while 30% fail in the second year and roughly half fail after five years. A staggering 70% of SMBs fail in their 10th year.
However, the study also found that 48% of small business owners believe the economy is going into a long-term recession.
13. Over the previous year, 44% of small businesses increased revenue, 18% had no change, and 38% decreased revenue (Source)
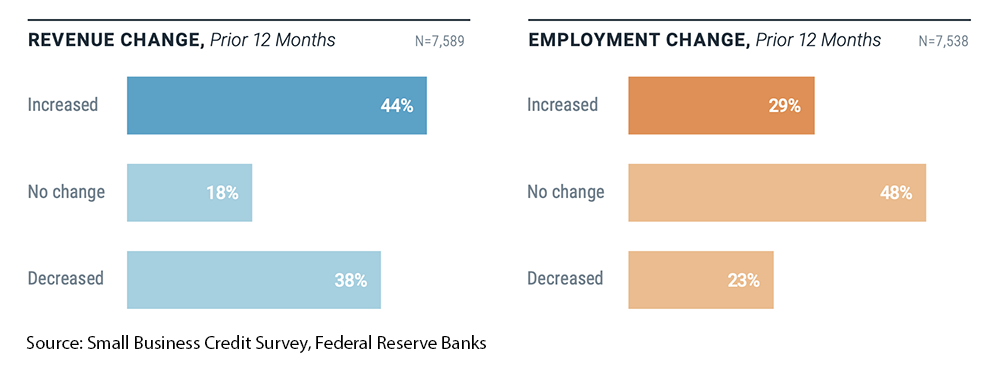
Meanwhile, 29% of small businesses had positive employment growth, 48% had no change, and 23% saw negative employment growth.
According to the 2023 report on employer firms, revenue growth was at 34% in 2019 while employment growth was at 21%. However, in 2020 during the pandemic these numbers fell steeply to -63% for revenue growth and -33% for employment growth.
Revenue growth and employment growth were still in negative figures in 2021, with revenue growth at -10% and employment growth at -9%. According to the most recent data in 2022, small businesses finally recovered with 7% revenue growth and 6% employment growth.
14. 56% of small businesses expect their revenue to increase in the next year, 22% expect no change, and 21% expect a decrease (Source)
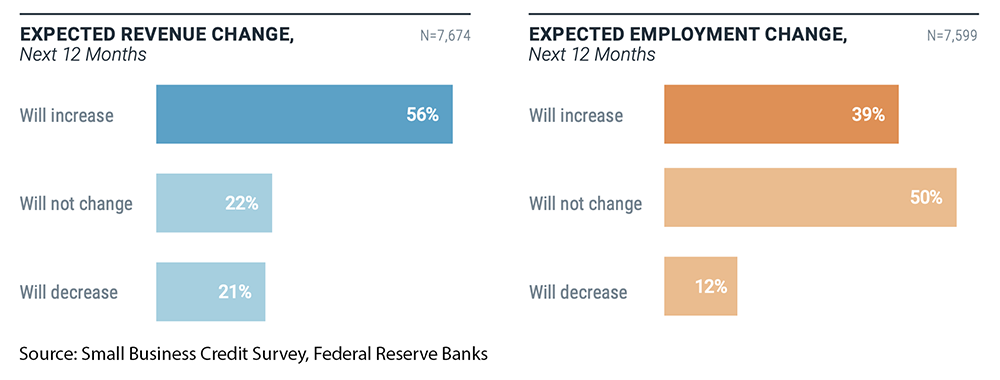
Meanwhile, 39% of small businesses expect to increase their number of employees in the next 12 months, 50% expect to see no change, and 12% expect a decrease in the number of employees.
The report found that in 2019, revenue growth expectations were at 58% while employment growth expectations were at 38%. This was already on a downward trend from the first survey in 2017. Then percentages dropped in 2020 with revenue growth expectations at 1% and employment growth expectations at 16%.
However, expectations recovered by 2021 with revenue growth expectations at 42% and employment growth expectations at 31%.
That being said, inflation and rising interest rates had a direct impact on 2022 percentages with revenue growth expectations dropping to 35% and employment growth expectations down to 27%.
The Most Important Takeaways From These Small Business Revenue Statistics
Small business statistics show that SMBs are primary drivers of not only the US economy but also the global economy. They comprise nearly 90% of businesses worldwide, and their revenues account for almost half of all global revenue earned.
While the rate at which startups and new small businesses appear increases each decade, there are macro setbacks to small business growth, especially with current inflationary trends and rising interest rates.
Despite those challenges, a significant majority of small business owners believe they can overcome current financial trends and have set high expectations for revenue and employment growth in the near future.